The 2026
Core Web Vitals Guide:

A New Ranking Factor
In 2026, Google doesn’t just ask “how fast is your site?” It asks “how seamless is the journey?” With the full rollout of AI Overviews and Generative Engine Optimization (GEO), Core Web Vitals have become the baseline requirement for appearing in AI-driven search results.
What are Core Web Vitals? How can business owners and web developers optimize for them? And how much will they impact your ranking? In this article, we’ll attempt to answer all of these questions (and many more).
As a heads up, things will get a bit technical in some parts (though we’ve tried to keep everything as beginner friendly as possible). If you don’t understand anything, you can ask your friendly neighbourhood web developer (Spider-Man is a kind of web developer, right?) or get in contact with us.
Table of Contents
What are Core Web Vitals?
Page Experience
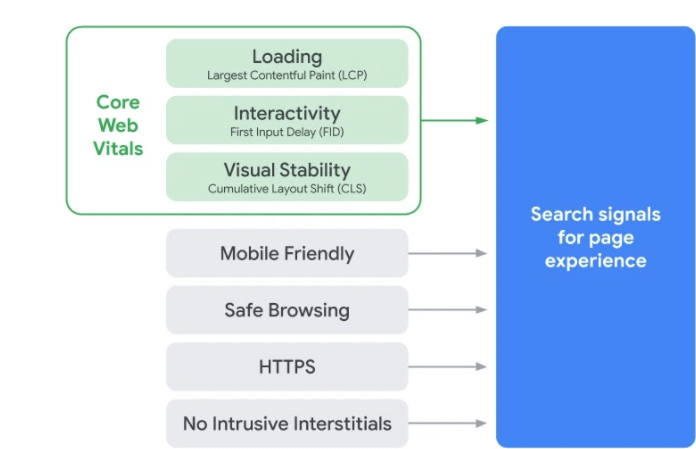
Core Web Vitals are part of a larger group of ranking factors rolling out, which Google calls page experience. Page experience consists of:
- Largest Contentful Paint (LCP) – Measures Loading Speed
- First Input Delay (FID) – Measures Interactivity
- Cumulative Layout Shift (CLS) – Measures Visual Stability
The 2026 Core Web Vitals Guide
We’re focusing on the green section of this chart – Core Web Vitals. We’ll touch on the other elements of page experience at the end of the article, but only briefly. They are important, but easier to explain, and not the focus of this article.
With that out of the way, let’s get to the core (pun intended) of this article!
All of these factors play an important part in a user’s experience on your website. If a page loads slowly, the user is likely to assume something isn’t working properly and leave. If it takes too long to interact with a page, the same thing can happen. And when a website is visually unstable, it can be hard to read, and users can click on the wrong links.
It’s in everyone’s interest to have websites that are fast, easy to interact with, and visually stable. Each of these metrics is given a score by Google – if you score under a certain threshold (it’s like golf), then your site will be more likely to rank well.
Throughout the rest of this piece, we’ll go over each of the three components of CWV in more detail. We’ll discuss how to measure CWV, and how to troubleshoot low scores.
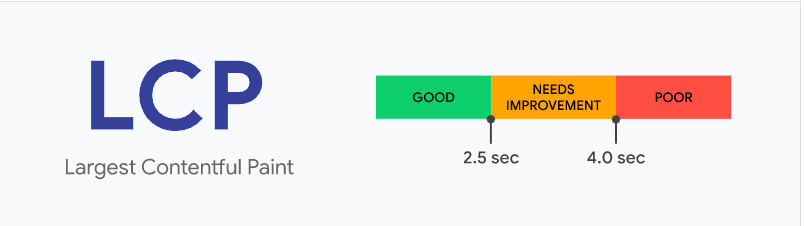
Largest Contentful Paint (LCP)
LCP is a measure of loading speed. More specifically, it measures how quickly the largest image or block of text in the viewport (the user’s visible area of the website) loads. The countdown starts when the page starts loading. LCP is scored as follows:
You want every page on your site to have a LCP loading score of 2.5 seconds or less. We’ll discuss how LCP is measured and how to troubleshoot LCP in later sections.
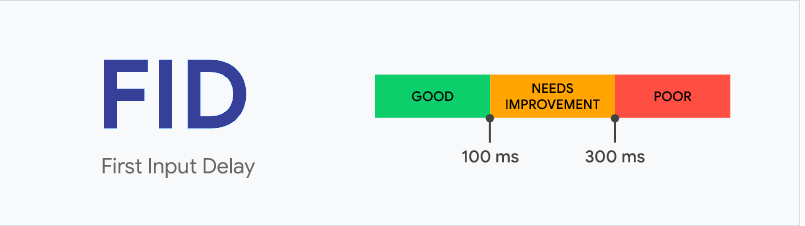
Note that FID only takes into account the first input, so technically, if other inputs take more time, it’s not reflected in the score. It is, nonetheless, best practice to limit the delay between interaction and response for any and all interactions on your pages.
First Input Delay (FID)
FID is a measure of interactivity. More specifically, it measures responsiveness to interaction – that is, how quickly a page responds when it’s being interacted with.
Clear as mud, right?
An example will help. Let’s say I click a link on a page. How long does it take for my browser to recognize the link has been clicked – in other words, how long does it take for me to start following the link? You can replace “following a link” with any kind of page interaction, including selecting an option from a menu or inputting information into the fields of a form.
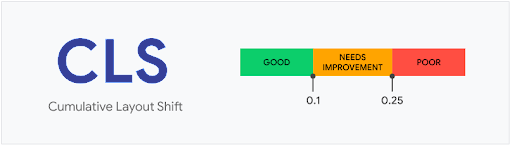
Cumulative Layout Shift (CLS)
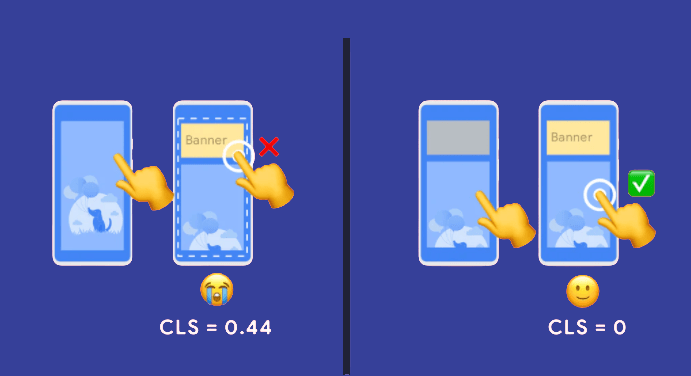
CLS is a measure of visual stability. More specifically, it looks at how unstable elements cause elements in the viewport to shift.
Let’s say you have a block-level element, like a paragraph of text, taking up 100% of the viewport. Above this block-level element, you have an unstable element, like a dynamic ad without a pre-reserved block of space, that loads after the other elements of the page. When this ad loads, it can bring about what appears in the viewport to shift downwards. This causes the page to shift by, say, 25%, where 25% of the previously readable text is now below the viewport.
This means you’ll want all of your pages to shift by a fraction of 0.1 or less – in other words, a shift of less than 10% is optimal. These shifts are calculated by impact fraction x distance fraction.
Impact fraction: 1 – the percentage of what was in the viewport (in decimals) that can no longer be seen. If 25% of what was in the viewport can no longer be seen, that means the impact fraction is 0.75 (1-0.25)
Distance fraction: The greatest distance unstable elements have moved divided by the viewport’s largest dimension (width or height). Assuming the already-loaded elements of our viewport have shifted down by 25%, we can safely say the unstable element is taking up 25% of our viewport’s height – that means we have a distance fraction of 0.25.
0.25 x 0.75 = 0.1875, so our hypothetical CLS falls into the “needs improvement” range.
Note that CLS only applies to unstable elements. This means shifts that were, say, prompted by the user do not count towards CLS.
tracking Core Web Vitals
Now that we understand what the Core Web Vitals are, what they’re trying to measure, and why they’re being implemented by Google, we can look at how we can track our CWV scores.
This process is a lot more complicated than it might seem at first. For those of you who aren’t technically inclined, tools like PageSpeed Insights can help you quickly assess how your pages are faring. The data PageSpeed Insights provides is somewhat incomplete, however – we’ll get into that in detail during this section.
But first, let’s dive into a subject that all the kids are talking about – real user monitoring (RUM) and lab data.
In order to evaluate how your pages (and your website) are scoring on CWV, Google aggregates data from a number of different Chrome users. This is known as real user monitoring.
You can understand why Google does this. No two devices are exactly alike – variations in hardware, connection speed, screen size, and other factors can all affect how a user experiences a web page. That’s why CWV is evaluated using RUM.
To be even more specific, CWV is measured by using 75th percentile of page views, across mobile and desktop devices, over the last 28 days.
Lab data, on the other hand, draws from the experience of just one user – the person who is running the tests. That means if you have a lightning fast connection, a page may load very quickly for your lab tests – even if that same page loads very slowly for most other users.
RUM is more broadly beneficial for determining how users are experiencing your website. Lab data, on the other hand, is more useful for getting instant feedback on whether or not changes you made to your page were effective.
With that in mind, let’s look at some of the most helpful tools for evaluating your CWV:
PageSpeed Insights
PageSpeed Insights is probably the most user-friendly tool when it comes to evaluating CWV. Let’s take a look at how PageSpeed Insights evaluates the music review site music snobs, like me, love to hate: Pitchfork.
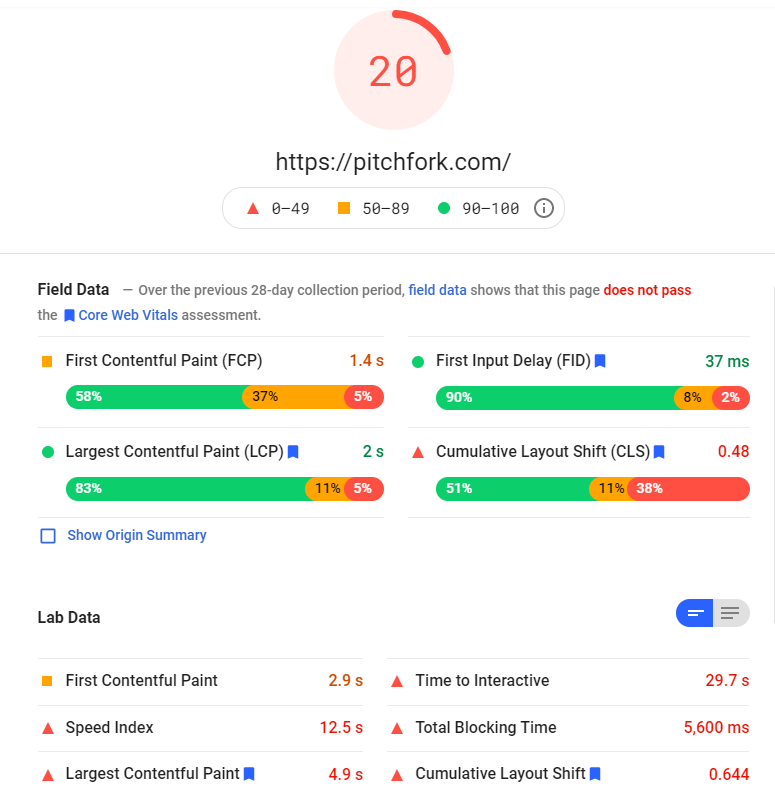
Looks like Pitchfork’s main page could use a bit of optimizing – maybe we should send them a pitch? (As always, pun intended).
Note that there are some non-CWV metrics being displayed here – one of them is First Contentful Paint (FCP), which tells you when the first (not the largest) piece of content is fully loaded. We don’t need to worry about that for now, but it is something that’s worth optimizing to improve user experience.
You’ll note that the scores are broken down (quite conveniently) into field data and lab data. This gives you the opportunity to see the Core Web Vitals score based on field data, and to quickly check how changes you’ve made to the site have affected lab data (without having to wait 28 days for all the field data to catch up – more on that later).
Note that the data displayed here is for mobile – you can change the data set to desktop by toggling in the top left corner.
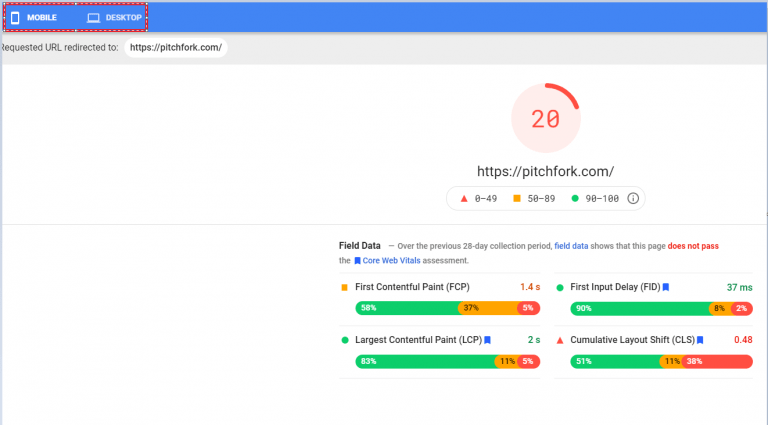
When we toggle to desktop, the score, field data, and lab data all change.
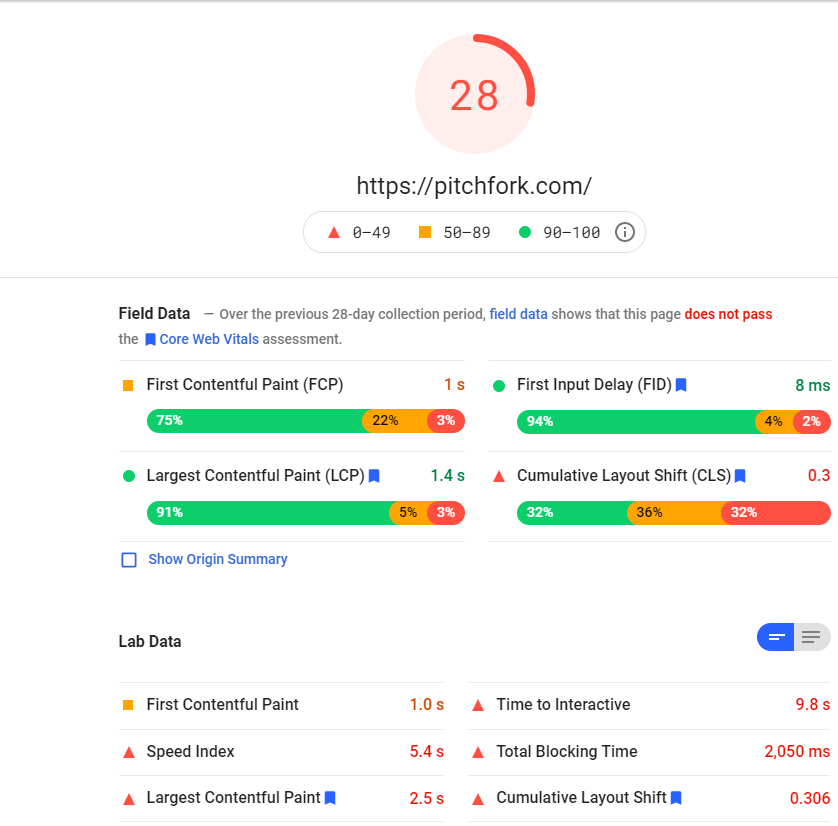
This is all extremely useful for understanding how you’re scoring at a glance. Things get even better, though. If we scroll down, Google will give us suggestions on how to optimize the site in question.

The glut of easily accessible information PageSpeed Insights provides makes it a go-to tool for technical optimization. You’ll note that the lab data differs somewhat in that it does not feature FID. That’s because FID is a RUM-only metric – TBT is an almost-equivalent lab metric, which we’ll discuss in the “Optimizing FID” section of this article.
PageSpeed Insights, true to its name, really only provides you with insights into how a single page performs. This makes it an excellent diagnostic tool, but only if you already know which pages need to be optimized. To figure out which pages need to be optimized, you need a site-wide scan – that’s where Search Console comes in:
Search Console
If you haven’t been using Google Search Console – you’re missing out. It has a host of incredibly powerful features. One of the newest features it has available?
You guessed it – a breakdown of your site by CWV scores.
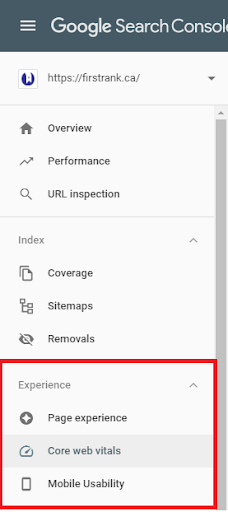
You can find the Core Web Vitals section of Search Console in the left hand nav bar, under the Experience section:
Once you open up the Core Web Vitals view, you’ll get a screen that looks a little something like this:
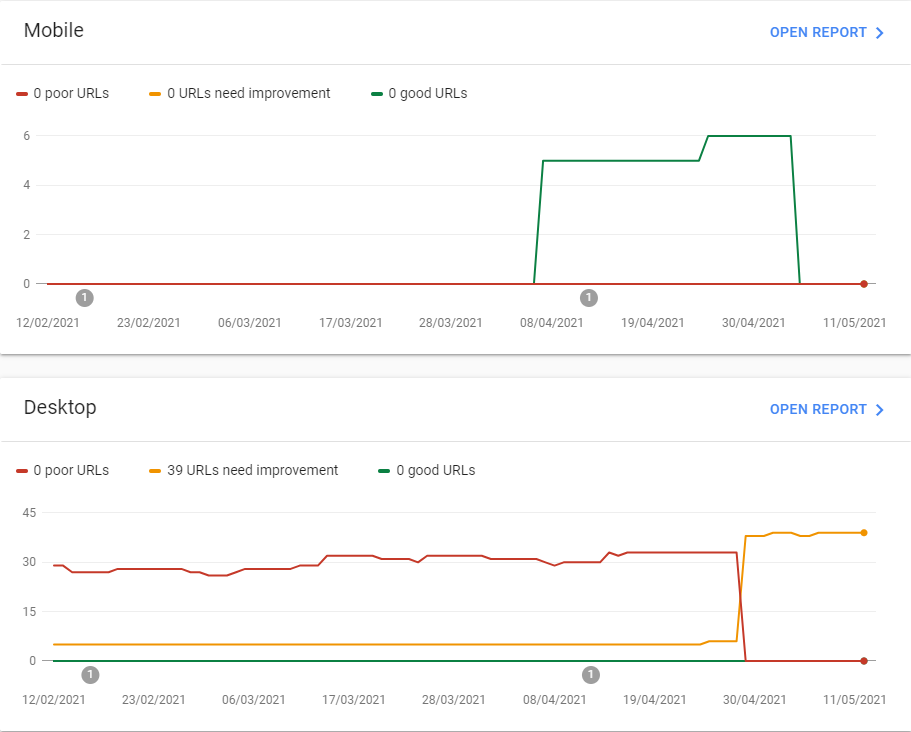
Our Mobile Report
Those are two pretty interesting graphs! 39 of our URLs need improvement on desktop – and we’re going to open the report and show you how we plan on improving those very URLs.
But what’s going on with our mobile CWVs? How is it that none of our URLs are even registering?
It’s extremely likely that we simply haven’t had enough mobile impressions in the last 28 days for Google to give us feedback on our CWVs. Remember, CWVs are based on the 75th percentile of impressions for the last 28 days – and that data is supposed to be anonymized. When there are insufficient impressions, Google simply doesn’t report anything for your URLs.
That doesn’t mean our mobile URLs are doing poorly – in fact, when we have enough impressions, they all seem to be doing quite well! What it does mean is that not very many people are looking up our SEO services on their phones. And, that makes a lot of sense – SEO services are something you’re most likely to read about sitting at a desk, on your computer, in your office.
In fact, you’re probably reading this very article at your desk in your office right now. Let me know if I guessed right!
You want to focus on both your mobile and your desktop optimization. When you lack data on one of the two (or both), it’s a good idea to run tests using lab data to see if there’s anything you can optimize. Running PageSpeed Insights can also help corroborate our “lack of mobile impressions” theory. Take a look at this:
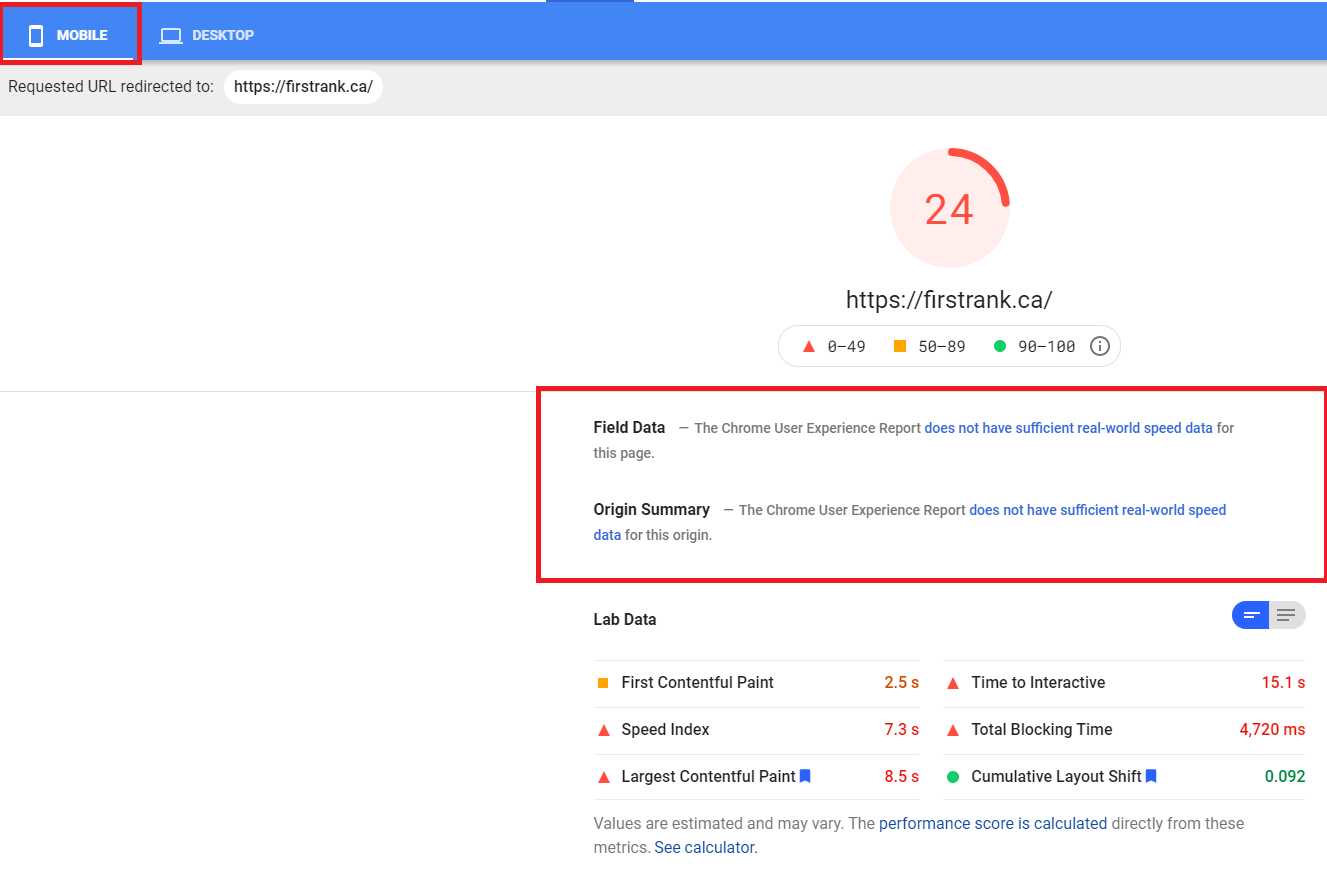
PageSpeed Insights confirms that for one of our URLs (our homepage), the Chrome User Experience Report (which we’ll talk about in the next section) does not have enough real-world data to give us CWV feedback.
Lab data shows that our homepage is not optimized for mobile. We may put the effort into fixing this at some point, but it’s not a priority for us.
Why? Because we almost never get mobile impressions, so our mobile score is unlikely to impact our ranking. Remember, CWV is evaluated only through RUM – you don’t get penalized if there aren’t enough mobile impressions to give your site a CWV score.
This example serves to show one way in which Search Console and PageSpeed Insights can be used, in tandem, to troubleshoot. Now let’s look at our desktop report.
Our Desktop Report
Here’s our desktop report:
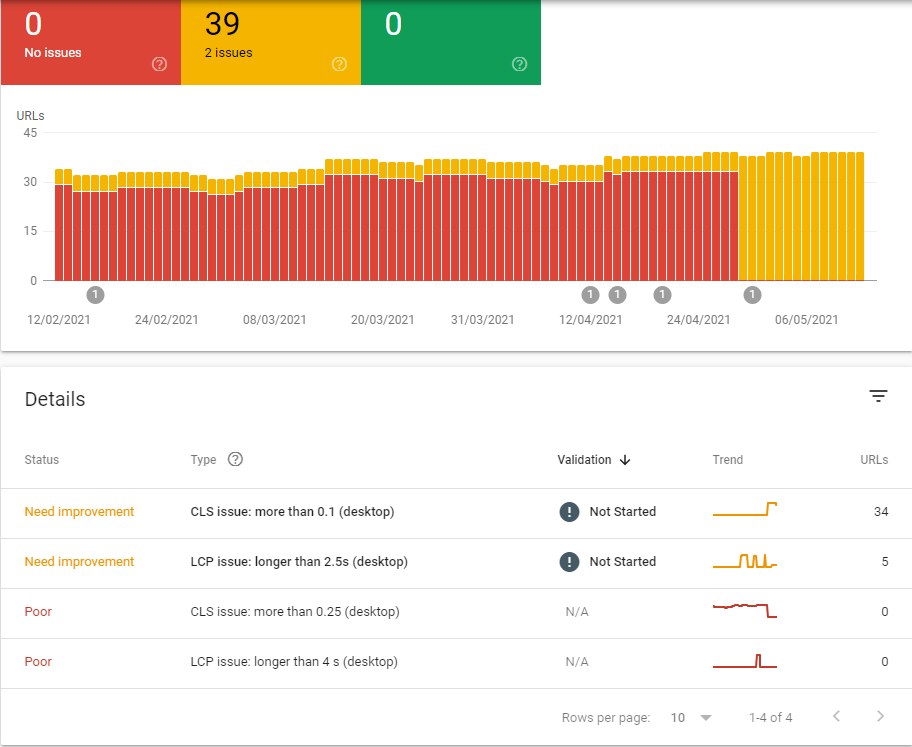
You can see that, for some time, we had a lot of URLs that were scoring “Poor” on CWVs. We’ve since fixed those issues – they haven’t come up since the 28th of April. We started fixing them before that, however – more on that in the “28 Days Later” section.
In the Details section, Search Console tells us exactly what is generating scores of “Needs improvement” or “Poor”. In our case, there are no URLs with CLS or LCP scores of “Poor”, but there are 34 URLs with CLS scores of “Need improvement” and 5 URLs with LCP scores of “Need improvement”.
By clicking on the issue that needs to be addressed, we get even more data! Take a look at this:
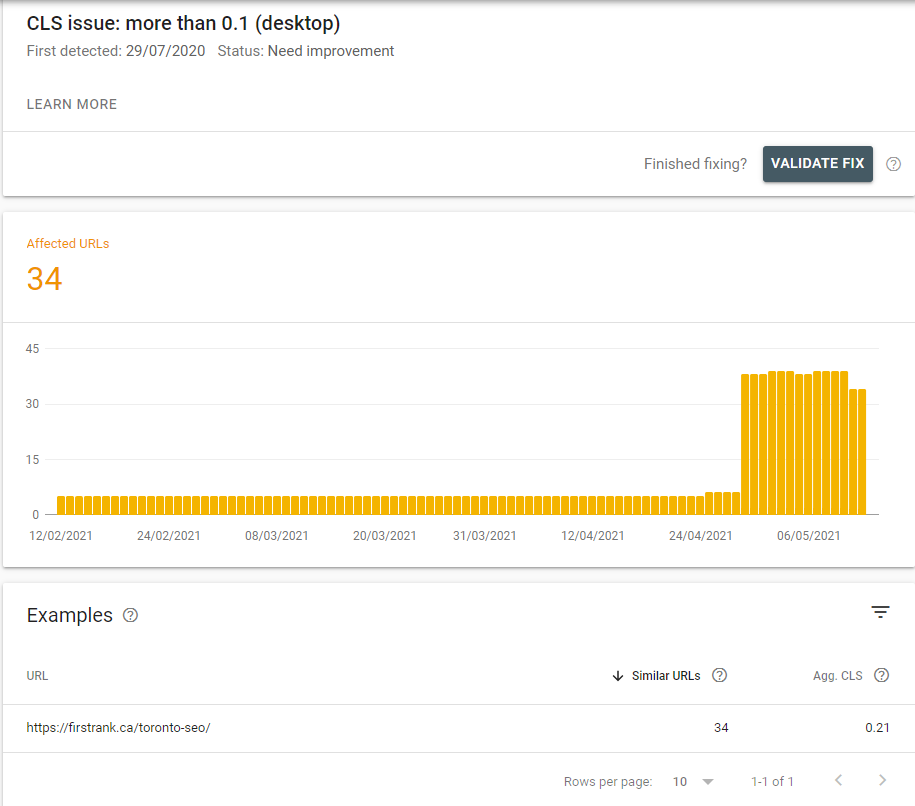
We see that 34 URLs are scoring higher than 0.1 on CLS for desktop. Search Console also provides us with an example: our Toronto SEO page has an aggregate CLS of 0.21. We can now input that URL into PageSpeed Insights to get more granular data on what exactly is causing our layout to shift.
Search Console knows that you’ll want to evaluate individual pages in PageSpeed Insights, so you can simply click the PageSpeed Insights button that appears under any URL to run a report.
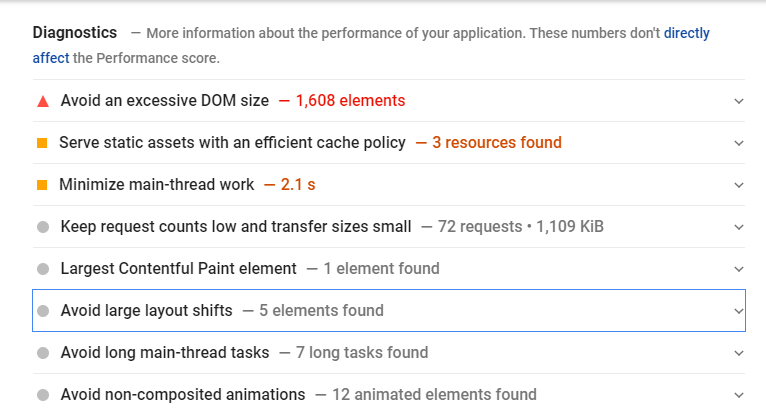
In the case of CLS issues, PageSpeed Insights isn’t actually the best tool to use – more on that later. We can, however, use it to check what elements are contributing the most to layout shifts:
We do this by going to the diagnostics section, and locating the “Avoid large layout shifts” section.
By expanding this section, we can find the elements of our page that are contributing the most to layout shifts:
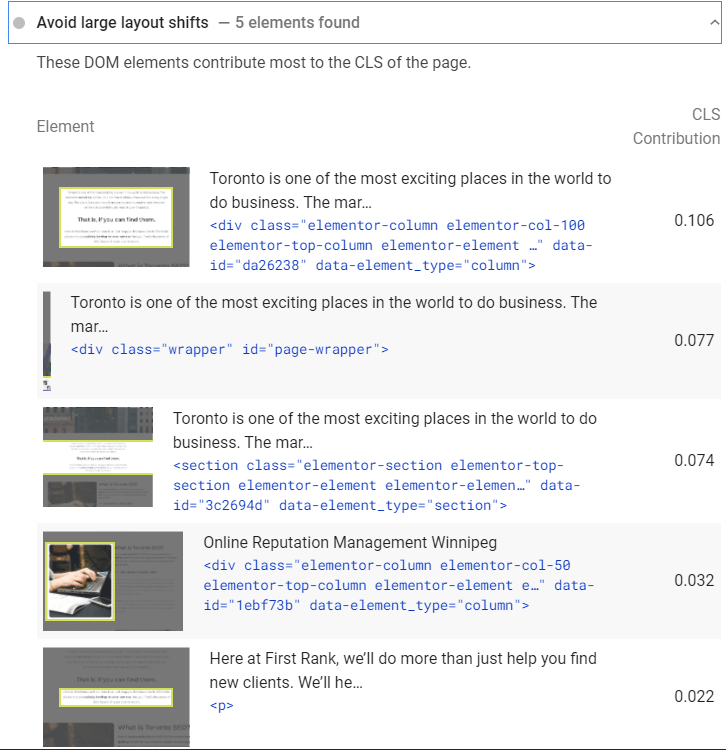
This can be a huge boon in our efforts to reduce CLS. We can see that by resolving layout shift issues with the three top contributing elements, we can effectively reduce our layout shift by 0.257 in the lab – that could mean a serious improvement on our average RUM-based CWV score.
Remember, the lab doesn’t tell you everything, but it can help you troubleshoot problems much more quickly than the ~28 days it takes for your CWV score to reflect changes.
In the “Optimizing for Core Web Vitals” section, we’ll talk more about how you can use all of the tools we’ve presented here to diagnose, troubleshoot, and fix any CWV-related issues that may crop up on your site. But before we get to that, let’s talk a bit more about the Chrome User Experience Report that powers all of this technology.
The CrUX of the issue
Both PageSpeed Insights and the Search Console Core Web Vitals Report fetch data from the Chrome User Experience (CrUX) Report.
This report aggregates data from Chrome users who:
- Have opted-in to syncing their browsing history
- Have not set up a Sync passphrase
- Have usage statistic reporting enabled
Chrome is by far and wide the most popular browser both on mobile and desktop. It is useful to know, however, that all of the reporting we’re doing for CWV does have a blind spot – non-Chrome browsers.
The plus side is that bad performance on non-Chrome browsers shouldn’t affect your CWV score, and thus shouldn’t affect CWV-based ranking signals. The downside is that users on legacy browsers and browsers like Safari and Edge may not necessarily benefit as much from CWV-based optimizations.
There’s also a small blind spot for Chrome users who aren’t part of data aggregation – users who, for example, haven’t opted-in to browser history syncing. It’s tough to say exactly who these users are, but given they have the wherewithal to set up Sync passphrases or disable usage statistics, it may be fair to say they’re power-users anyway. In other words, their devices are probably in the higher percentiles when it comes to CWVs anyway (as they’ll be using more powerful devices).
That’s all speculation on my part, though. They could all be Libertarians living in the woods with bad network connections! Either way, we won’t pay these blind spots any mind for the rest of this article, as they, by definition, aren’t part of CWV.
It’s also worth noting that the CrUX Report will give you data on non-indexed/robotted pages. These pages aren’t, however, a part of Search Console’s Core Web Vitals report. Keep this in mind when you’re looking at data from the next tool, the CrUX Dashboard. It’s difficult to say whether or not non-indexed pages will actually impact ranking signals (since, by definition, they aren’t showing up in search results). Don’t prioritize these pages, but if you have the time, it may be best to err on the side of caution.
Looker Studio and the CrUX Dashboard
You can get a lot of information by creating a custom CrUX Dashboard, using Google’s Looker Studio. This dashboard can provide you with a lot of information that you might find difficult to pull from PageSpeed Insights or Search Console. Rick Viscomi created a complete guide to the CrUX Dashboard, which I highly recommend you check out. It’s ridiculously easy to set up, and you get a lot of data.
Here’s the distribution of connections First Rank got across different devices in March and April:
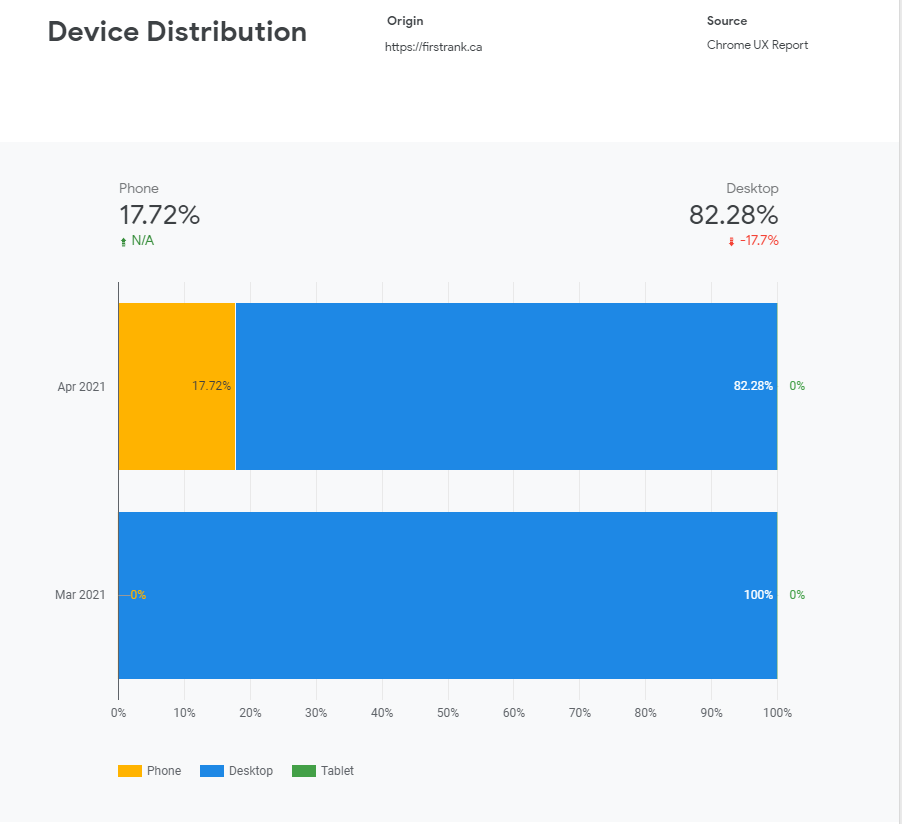
As you can see, we get almost no phone connections – and literally no tablet connections. As we’ve discussed, that stands to reason – as an SEO company, desktop connections are our bread and butter.
You can get a lot more information from the CrUX Dashboard, including how devices are connecting to your site (4G, 3G, etc.), and information on other, CWV-related metrics like Time To First Byte (TTFB).
The CrUX Dashboard is incredibly handy – we’ll use it a few times when we discuss diagnostics in the Optimizing Core Web Vitals section. It’s an origin-based tool – meaning it tracks CWV across your entire site, instead of individual pages.
All of the tools we’ve discussed so far give you information based on the CrUX Report – but all of that information is based on the 75th percentile of site visits over a 28 day period. That means when you make changes to your website, you’ll have to wait a number of days before your CWV scores change.
Old scores need to “drop off” before your CWV score reflects the changes you made. Because CWV scores are based on the 75th percentile, if you’ve made drastic improvements to your site, you’ll likely see a sudden flip of scores – likely around Day 21, when you’re 75% of the way into the 28 days. The 75th percentile was chosen to filter out extreme data, so extremely poor scores start disappearing around day 21 (when you, hypothetically, have 75% good scores and 25% poor scores).
99.9% of people reading this won’t need to go any further with tools. But I know that some of you are looking for incredibly granular data – you want to know what is changing on Day 1, based on RUM.
You have two choices. First, you can purchase RUM reporting tools to give you more detailed insights into how users are experiencing your web pages. We’re not going to recommend any here, as they all have different methods of reporting, and different pros and cons. Going over this software would take an entirely new article. Hopefully, if you need more granular data, you know what you’re looking for.
The second (and free) option is to use the web-vitals JavaScript library. You can use that library in conjunction with the Web Vitals Report app to create visualizations of the data that the web-vitals library sends to your Google Analytics.
If you read those GitHub pages, and you find yourself completely lost, don’t worry – it’s likely that you won’t need data as granular as what the web-vitals library provides.
There are several other tools you can use to track CWVs, including Lighthouse and Chrome DevTools. We’ll talk a bit more about Chrome DevTools in the section on Optimizing CLS. Lighthouse won’t come up in the rest of this article, but feel free to read about it and other tools on Google’s tools to measure Core Web Vitals page.
Optimizing for Core Web Vitals
We’ve just been on quite a journey together! By now, you should know what the Core Web Vitals are, how they’re tracked, the difference between RUM and lab data, and the tools we can use to measure CWVs. With all of that out of the way, we can finally start talking about the most important part of this whole article:
Optimizing your web pages for Core Web Vitals.
You’ll want to do this as soon as possible – remember, Core Web Vitals are very important.
We’re going to break this section down into three parts – one for each of the CWV metrics. PageSpeed Insights is going to be a huge asset to you, here. Remember to use Search Console to identify which issues are plaguing each page before drilling down, and keep in mind that similar pages are likely to have similar issues. Don’t go creating work for yourself where you don’t need to!
And a quick note on workflow – consider prioritizing pages that are ranked “Poor”, and prioritizing pages that see a lot of traffic.
Optimizing LCP
To optimize LCP, we’re going to first need to determine what a page’s LCP is. There are two ways of going about this.
The first is to use DevTools – the tool we alluded to briefly in the “Tracking Core Web Vitals” section. To do this, open Chrome, go to the page you want to analyze, and press Control-Shift-C on Windows or Command-Shift-C on Mac.
You should get a page that looks like this:
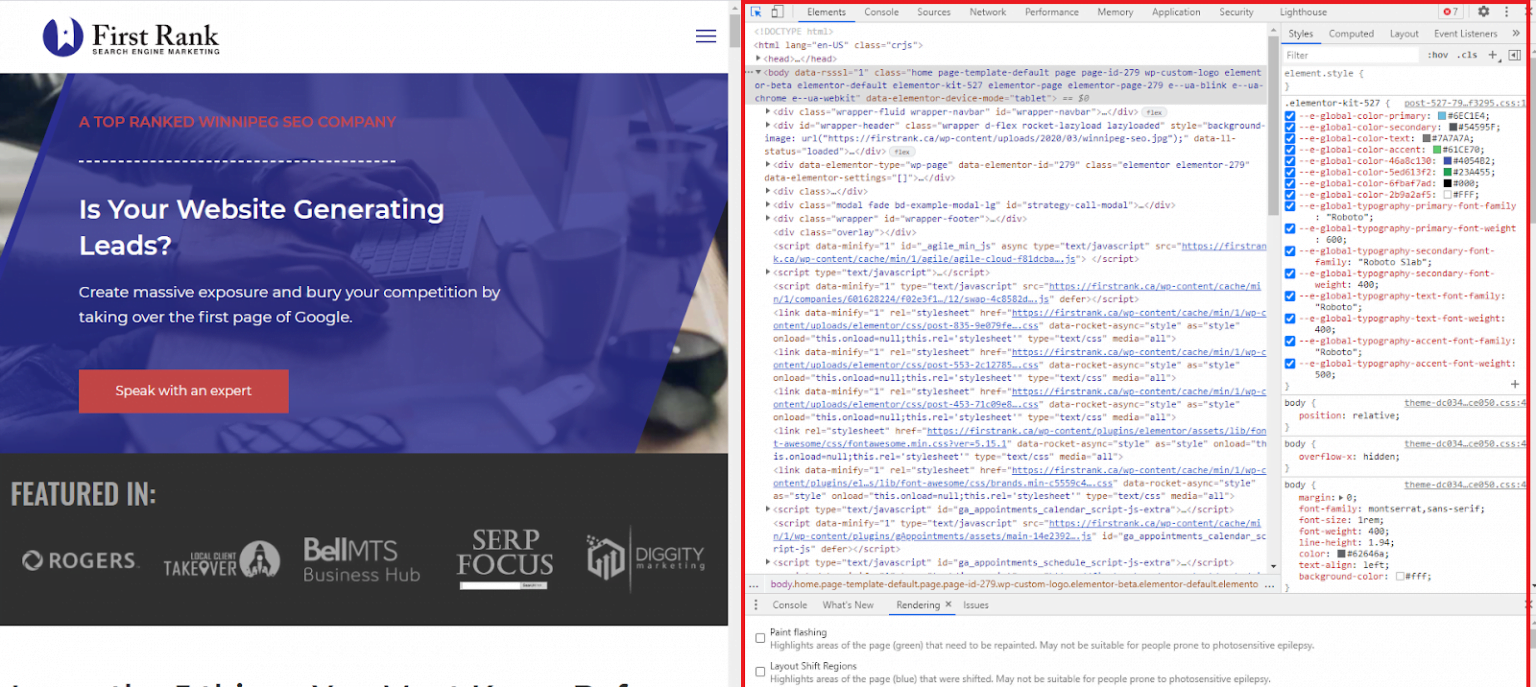
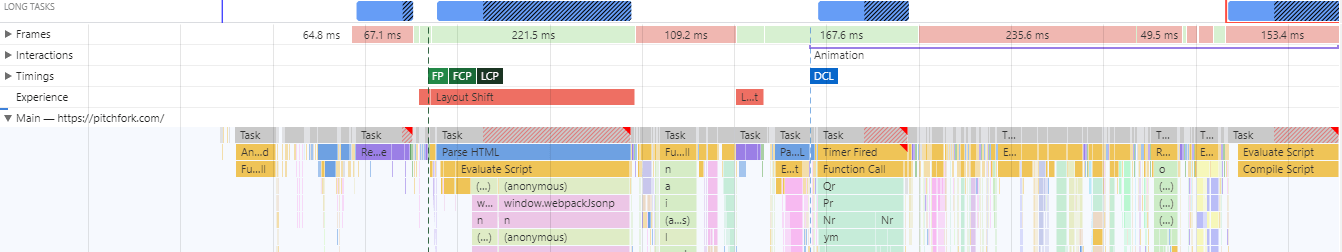
The area in the red box is DevTools. You can then go to the Performance tab in DevTools.
In the Performance tab, you’ll hit the Refresh button. From there, you’ll find the Timings row, and within it, the LCP icon. Simply hover over the LCP icon, and DevTools will highlight your LCP.
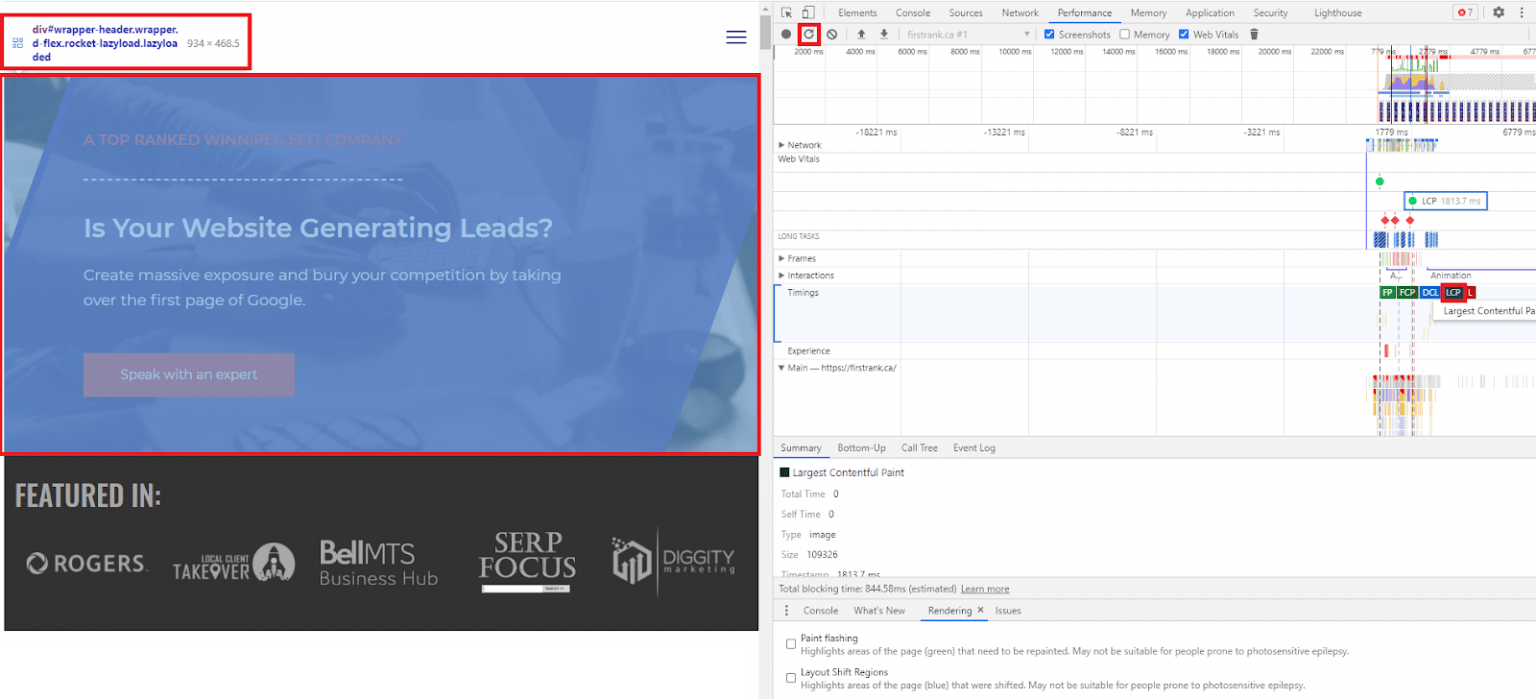
As you can see, by hovering over LCP, the visual LCP element is highlighted, and the HTML element is brought up in code form. We can also see, in milliseconds, when the LCP finishes loading.
With that out of the way, we can start optimizing our LCP!
Optimizing server response time
A common cause of slow LCP load times is slow server response time. If your server is slow to respond, it stands to reason that your content will load slowly!
This is easy to diagnose – you’ll want to check Time To First Byte (TTFB). Your TTFB should be 500 ms or less – 200 ms or less is best. You can do this this in a few ways:
- Use tools like ByteCheck and WebPageTest. WebPageTest gives you more options and more information, ByteCheck is faster.
- Use the CrUX Report Dashboard. Page six features TTFB information. It looks like this:
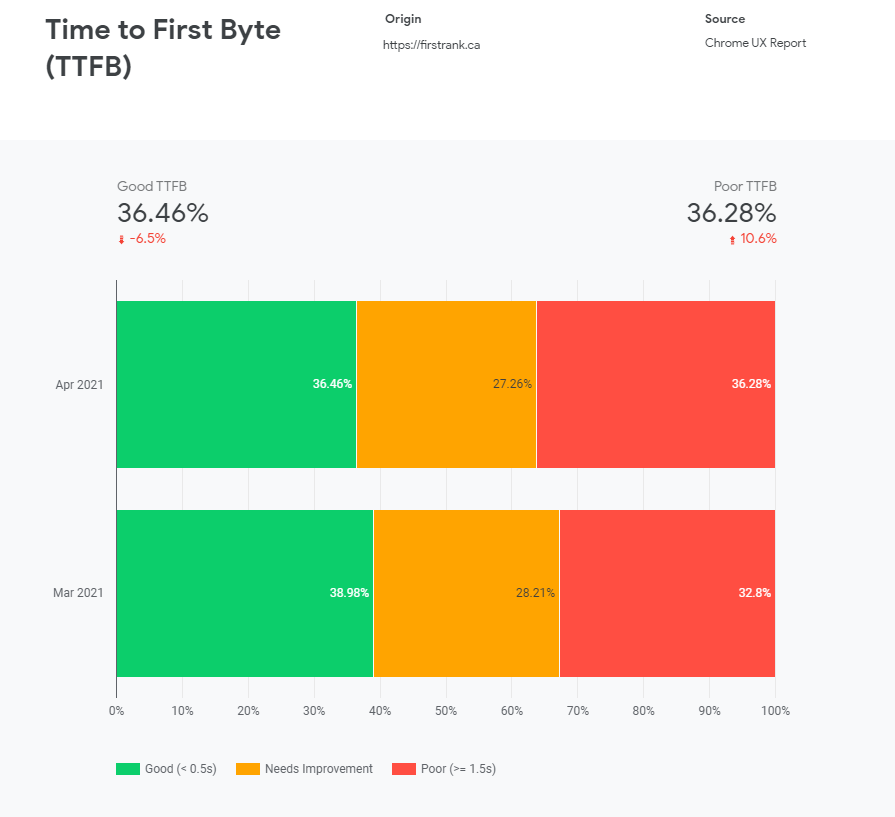
Consistently poor TTFB is a sure sign that your server isn’t optimized. Optimize your server – there are plenty of potential server-side delays.
You can also consider:
- Using a Content Delivery Network (CDN)
- Caching assets
- Serving HTML pages cache-first
- Establishing third-party connections early
Some (but certainly not most) sites may also benefit from using Signed Exchanges (SXGs). Read Katie Hempenius’s post about SXGs to learn more, but don’t use them unless you know what you’re doing.
Optimizing Code
There is all sorts of nasty, render-blocking code that can delay the loading of your LCP. That’s one of the reasons LCP is such a great metric – it helps you recognize all the coding inefficiencies that are stopping content from being delivered to the user. We’ll specifically look at two common culprits for slow loading: JavaScript and CSS.
When you run PageSpeed Insights, you’ll get flags that tell you how your code isn’t optimized. Going waaaaaay back in time to our Pitchfork example, you’ll see that there are a ton of clues as to how how code may be hurting LCP load times:
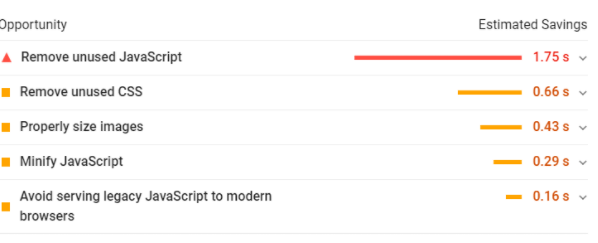
- Minify your code! Use Google’s guide to Minifying CSS. Use a JavaScript minifying tool like Terser to minify JavaScript. Minifying is easy, and it can result in huge improvements to your LCP metric.
- Use code splitting to reduce the size of your JavaScript payloads. Lazy-loading is your friend! Above-the-fold content should be served first.
- Scrap any code that isn’t being used. You’d be amazed how much JS and CSS gets coded into a site, forgotten about, and never used after a few updates. Get rid of it. It’s like spring cleaning – for code! Be sure that the CSS isn’t being used on different pages – if it is, create a new CSS file with only that code for those pages.
- Inline critical CSS – apply directly to! Critical CSS is the minimum set of render-blocking CSS that must be loaded before the page can be viewed. Everything else can be lazy-loaded. If you’re not sure what elements of your CSS are critical, use tools like Critical and Critters.
- Most browsers (and, thankfully, Googlebot), are now evergreen. That means few of your users will be using outdated, legacy browsers, and that you probably don’t need to be using legacy polyfills. Check out the Serving Legacy Code to Legacy Browsers guide by Shubham over at Smashing Magazine. And let’s all hope everyone stops using IE soon enough.
Optimizing Resources
Poorly optimized content is one of the most obvious causes of bad LCP metrics – if that hero image is 46 terabytes, you’d best believe it’s never going to finish loading.
If your LCP is an image, optimize and compress it. You’ll see an audit flag in PageSpeed Insights or Lighthouse (which you can access in DevTools) if that’s what you need to do. Use an image compressor like Imagemin. Convert your image to a modern format (I don’t want to see anyone using bitmaps, okay?). Google recommends JPEG 2000, JPEG XR, and WebP.
Use responsive images.
Here are some other resource optimization tips:
- Preload important resources using the rel=”preload” attribute
- Adaptively serve assets based on network connection. You can do this using the Network Information API
- Consider using an Image CDN
- Compress text files using tools like Brotli
Avoid client-side rendering wherever you can. If you must use client-side rendering, use pre-rendering, and make sure your JavaScript is optimized, and that you’re using as little critical JavaScript as possible.
Optimizing FID
TBT and FID
FID is a RUM-only metric. Total Blocking Time is a lab metric that, while not equivalent to FID, usually correlates to FID. In other words, improvements to your TBT score will usually mean improvements to your FID score down the line.
All this is to say, that when you’re testing the optimizations we present here, check for improvements to your TBT score in PageSpeed Insights or other lab test tools!
Reduce JavaScript execution time
Poor FID is almost universally caused by heavy JavaScript execution. The first thing you should check is how many third-party scripts you’re using. After all, third-party scripts aren’t under your control. You can’t optimize third-party scripts, so if they’re taking too long to execute, consider scrapping them and replacing them with your own code.
You can use code splitting to reduce JS execution time (as discussed in the LCP section). Where possible, find ways to break up Long Tasks – tasks which take more than 50 ms. You can find Long Tasks in the Performance tab of DevTools.
Use a web worker
You can use web workers to run JavaScript off the main thread and speed up your FID and TBT. Note that not all JavaScript can be moved to web workers – they don’t have access to the DOM or some widely used APIs. Nonetheless, every piece of code you can take off the main thread is a step closer to optimized FID.
Follow the JavaScript optimization advice in the LCP section
Getting rid of legacy polyfills, code-splitting, lazy-loading, minifying, compressing, and deferring (or eliminating) unused JavaScript can all help improve FID in the same way they help improve LCP.
Optimizing CLS
What’s causing your layout to shift? You can identify some elements using the method we described in the “Our desktop report section” – that is, by using PageSpeed Insights and clicking on the “Avoid large layout shifts” Diagnostic.
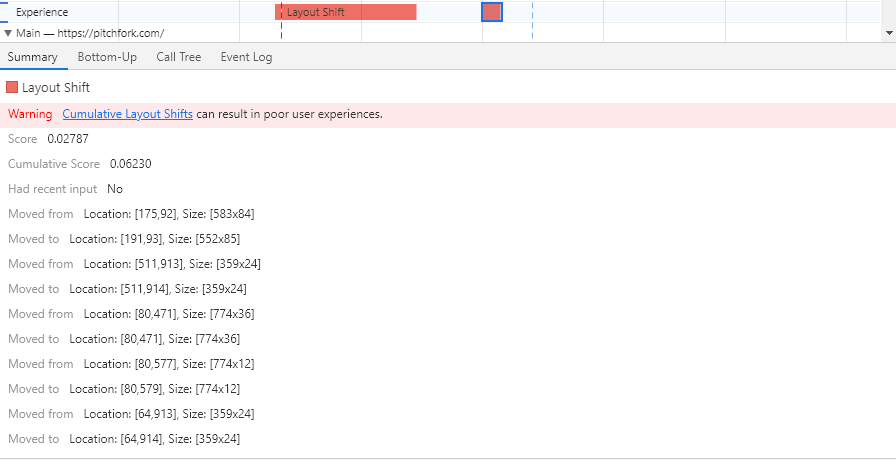
You can also use DevTools to check how and where shifts are occurring:
Simply highlight over the “Moved to” and “Moved from” to see how and where elements are shifting.
It’s not just the elements on your page that are shifting – CLS is the hardest CWV to pin down. Google itself is trying to figure out the best way to measure CLS – it’s an incredibly important metric (shifting pages are REALLY annoying), but there’s a lot of variance. It’s to the point that Google has a page called Evolving CLS – last updated in April – to be kinder to pages that were open for a long time.
There’s a lot of variance in CLS because there are so many variables on how a web page will be served up. Different users will see different content (ad-blockers, A/B testing, etc.). Different users will use different sizes of browser windows. Visual variance is incredibly high. And it’s hard to lab test because what you’ll see in a lab will differ dramatically from the aggregate of what all users see.
So, we’re going to give you best practices for optimizing CLS right now, but new advice may become available as the metric changes. Stay tuned.
Add dimension to your content
All of your video and image elements should have width and height attributes. Use an Aspect Ratio calculator if you need one. When working with responsive images, set the width and height attributes to the same value.
Optimize fonts
If you’re using webfonts, a flash of invisible text (FOIT) or flash of unstyled text (FOUT) can both cause layout shifts. You can avoid FOIT by using font-display with the optional value in your CSS. To avoid FOUT, you can preload fonts with link rel=”preload”, but keep in mind that preloads are render-blocking.
You might also consider using Font Loading API.
Optimizing ads
Avoid placing ads at the top of the viewport – when the first paragraph a user is reading suddenly shifts down, they might decide to suddenly shift away from your site!
And whenever you’re using ads, statically reserve an ad slot for the largest ad that could be served. There may be blank space when a smaller ad is served, but that blank space is generally better than a massive CLS-related penalty to your rank.
Optimizing embeds
Embeddable widgets are used all over the web nowadays, and whether they’re serving up Google Maps or social media posts, they can cause layout shifts. Much like you’ve reserved an ad slot for the largest advertisement that could be served up, you want to style a placeholder for the largest embed that could be served up.
Fortunately, there tends to be less variance with embeds, so you’ll be able to create a snug little container for your widget!
Optimizing dynamic content
You know where this is going. You want to reserve space for your dynamic content. Don’t load new content above existing content. Reserve space for dynamic content in the same way you reserve space for ads and embeds. Your cookie notice may very well be guilty of dynamic content sins – reserve space for it.
Some final Thoughts
Are You Experienced?
Core Web Vitals only make up a portion of the total page experience ranking signal. They’re definitely an important portion, but I thought it would be a good idea to take a step back and make sure you’re covering your other bases, too.
- Mobile-friendly: You can test if your page is mobile-friendly very easily by using the Mobile-Friendly Test. Responsive Web Design is becoming industry standard, but Dynamic Serving can serve (another pun!) where needed.
- Safe-browsing: Is your website malicious? I sure hope not! You’ve certainly intuited this point – Google doesn’t like sites that serve up malware or that are used for phishing.
- HTTPS: Use HTTPS on all of your pages, and make sure HTTP requests are redirected to the HTTPS URL. Let’s Encrypt is a great place to start if you want free HTTPS.
- No intrusive interstitials: Don’t use annoying pop-ups (especially not on mobile). If you have to use annoying pop-ups, make sure it’s really easy for users to hit that X button and get rid of them.
As you can see, the other page experience signals aren’t nearly as complex as Core Web Vitals. Though we could dedicate a few more words to them, that will have to wait for another article.
What we’ve discussed here are best practices that should stay around for a long time to come – even if Core Web Vitals changes. The tools we’ve recommended may change rather quickly, however – and new, better tools may come to light. We’re all clamouring to make the most out of Core Web Vitals – you’d better believe there are going to be some innovative products on the market soon. And, knowing the generosity of web devs, many of these products may be free.
We’re also waiting to see exactly how impactful CWV’s ranking signals will be. Obviously, we expect it to be quite important – Google doesn’t announce ranking changes and give SEOs months of warning for no reason.
Expect to see a lot of data (and a lot of articles) about how it is impacting rankings as we go through the summer – and even more articles when the signal reaches full strength at the end of August (and into the fall).
As we gather more information, we’ll be able to determine how much different types of websites should focus on Core Web Vitals. This is SEO after all – things are constantly changing, and we’re constantly learning.
We’ve just gone over a ton of information. I encourage you to play around with all of the tools we’ve discussed here, and to experiment with the techniques we’ve laid out to optimize your pages for CWV.
You don’t have to do it yourself, though. At First Rank – A Canadian SEO company, we can tackle all of this – and way more – for you. We’ll optimize and monitor. We’ll adjust as new information comes in – information we’ve compiled from thousands of other pages. When it comes to new ranking signals, data is your friend. We’ve got the data.
Here, at the end of this piece, I’d like to thank you for reading. I truly hope this article was as interesting for you to read as it was for me to write. Most of all, I hope it helps you optimize your website in a way that improves your life, and the lives of your users.